Designing Charts for PowerShell
- Details
- Written by David Corrales
- Last Updated: 14 June 2016
- Created: 05 May 2011
- Hits: 23118
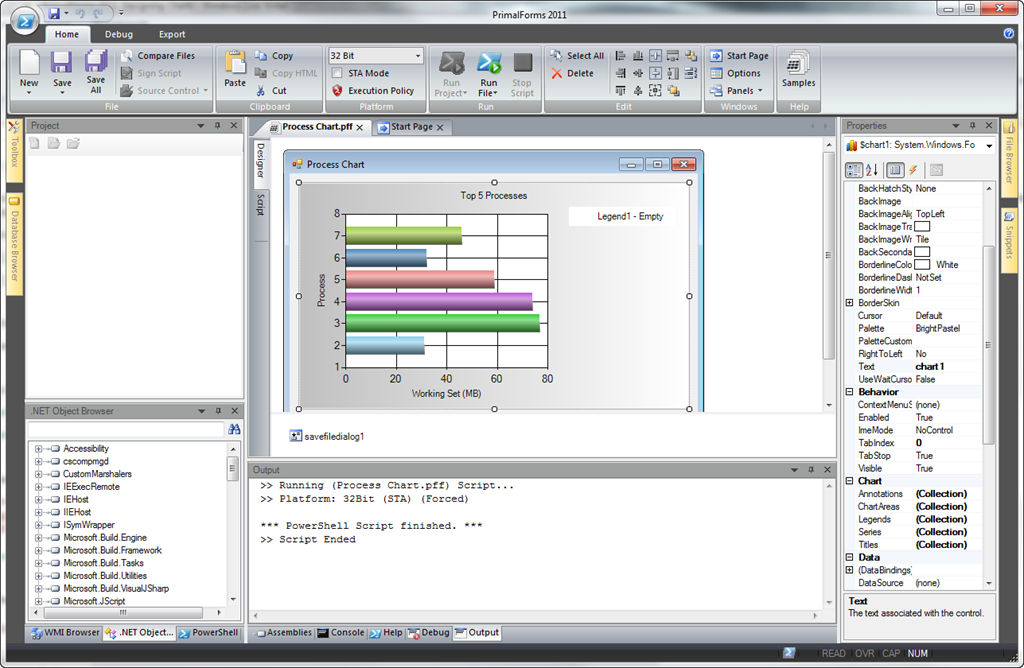
The Charting with PowerShell blog post demonstrates how to create graphs in PowerShell using WinForms. After reading this article and realizing all the work involved, we added an option to PowerShell Studio that lets you use Microsoft Chart Controls to design your charts visually, instead of coding them manually.
Because the chart controls are not part of the core .NET library, you need to download the library to use them.
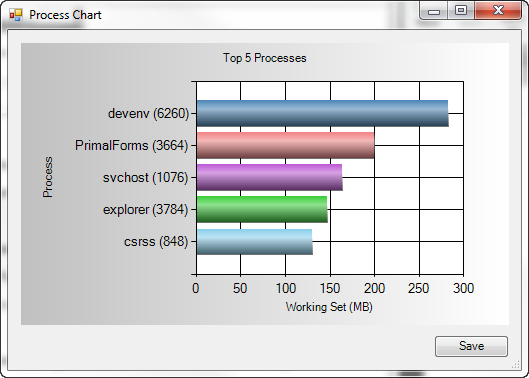
Top Processes Bar Graph Sample
To demonstrate the control, I created two sample forms. The first sample is based on Richard’s blog post. It displays the five processes with the highest Working Set value in a bar graph. The form also includes a button to convert the chart to a PNG image.
Since the Chart is not the easiest control to use, I created helper functions to make it simpler to display your results in a chart (See sample files for function definitions):
Load-Chart – By using this function you need not worry about what properties to set or what objects to create. It will handle most of the dirty work for you. All you need to do is pass the points to plot.
Clear-Chart – This function will remove all the chart areas, series, and points.
With these helper functions loading the chart boils down to the following:
    $Processes = Get-Process | Sort-Object -Property WS | Select-Object Name,WS,ID -Last 5
    $ProcNames = @(foreach($Proc in $Processes){$Proc.Name + " (" + $Proc.ID + ")"})
    $WS = @(foreach($Proc in $Processes){$Proc.WS/1MB})

    Load-Chart $chart1 -XPoints $ProcNames -YPoints $WS
To save the chart as an image, you can use the following method:
$Chart1.SaveImage("Filepath", "PNG")
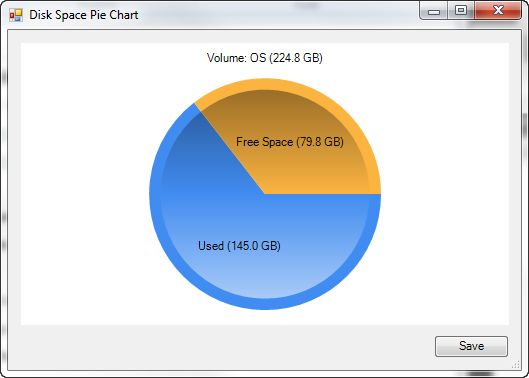
Disk Space Pie Chart Sample
The second sample gathers information about the system’s hard drives and displays them using pie charts.
Using the following script you can display a pie chart for each hard drive:
    #Get Disk space using WMI and make sure it is an array
    $Disks = @(Get-WMIObject Win32_LogicalDisk -filter "DriveType=3" )

    #Remove all the current charts
    Clear-Chart $chart1

    #Loop through each drive
    foreach($disk in $Disks)
    {
        $UsedSpace =(($disk.size - $disk.freespace)/1gb)
        $FreeSpace = ($disk.freespace/1gb)

        #Load a Chart for each Drive
        Load-Chart $chart1 -XPoints ("Used ({0:N1} GB)" -f $UsedSpace),`
        ("Free Space ({0:N1} GB)" -f $FreeSpace) -YPoints $UsedSpace, $FreeSpace `
        -ChartType "Pie" `
        -Title ("Volume: {0} ({1:N1} GB)" -f $disk.VolumeName,($disk.size/1gb) )`
        -Append
    }

    #Set Custom Style
    foreach ($Series in $chart1.Series)
    {
        $Series.CustomProperties = "PieDrawingStyle=Concave"
    }
When you specify the -Append parameter, the Load-Chart function will add another chart area to the control instead of replacing the first chart.
Since these forms are dependent on the Microsoft Chart Controls, any machine running the script (including any packaged executable) will require the controls to be installed beforehand.
To check for the Microsoft Chart Controls I added the following lines to the OnApplicationLoad function:
if([Reflection.Assembly]::LoadWithPartialName("System.Windows.Forms.DataVisualization") -eq $null)
{
    #Microsoft Chart Controls are not installed
    [void][reflection.assembly]::Load("System.Windows.Forms, Version=2.0.0.0,`
    Culture=neutral, PublicKeyToken=b77a5c561934e089")
    [void][System.Windows.Forms.MessageBox]::Show("Microsoft Chart Controls for Microsoft .NET 3.5`
    Framework is required", "Microsoft Chart Controls Required")
    #Open the URL
    [System.Diagnostics.Process]::Start("http://www.microsoft.com/downloads/en/`
    details.aspx?familyid=130F7986-BF49-4FE5-9CA8-910AE6EA442C&displaylang=en");
    return $false
}
Download the Sample Charts here.
For licensed customers, use the forum associated with your product in our Product Support Forums for Registered Customers.
For users of trial versions, please post in our Former and Future Customers - Questions forum.


