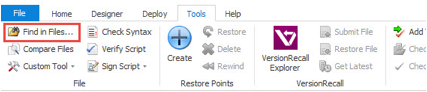
Find in Files allows you to search multiple files without having to open each file individually, as you would have done in the previous versions of PowerShell Studio. The Find in Files button is location in the Tools tab of the Ribbon:
You can also access the Find in Files tool using the keyboard shortcut (Ctrl + Shift + F).
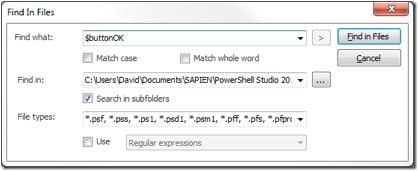
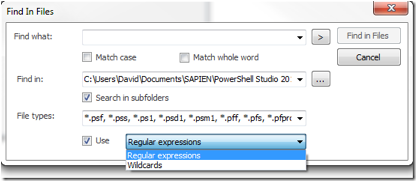
When you press the Find in Files button you are presented with the following dialog:
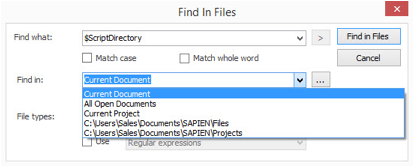
Current Document
Searches in the current document only.
All Open Documents
Searches in all the open documents.
Current Project
Search in all the project files.
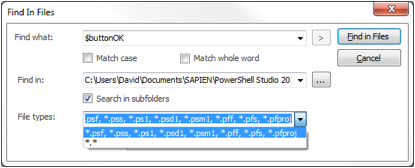
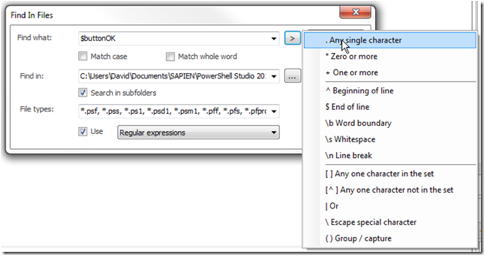
Once you enter the necessary fields, you can press the Find in Files button to kick off the search.
The Find in Files feature is a very useful tool to quick find the text you are looking for within a large group of files.
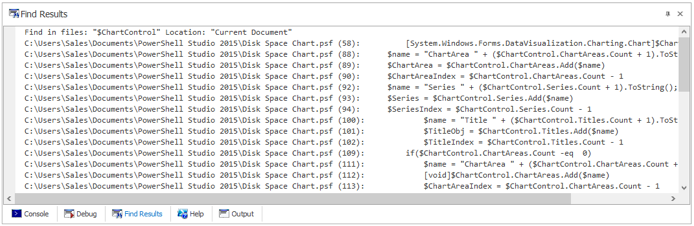
The search results will appear within the Find in Files panel as the search progresses.
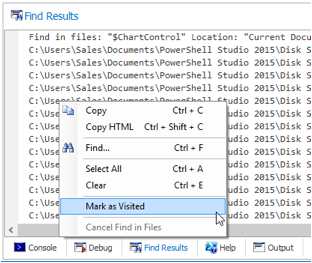
Double clicking on a search result will open the file at the line specified in the result. Viewed results are distinguished with a check mark on the left column:
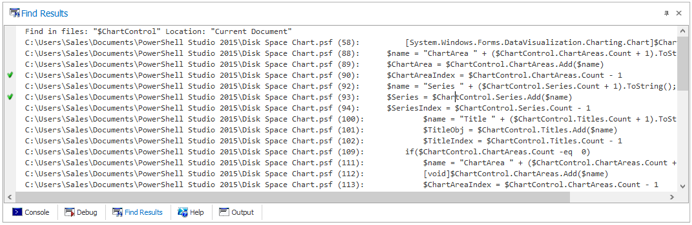
The check mark indicator helps you keep track of all of the locations you visited. In addition, you have the option to manually mark a result as visited or unvisited using the context menu:
Find All References can be found in the editor's context menu:
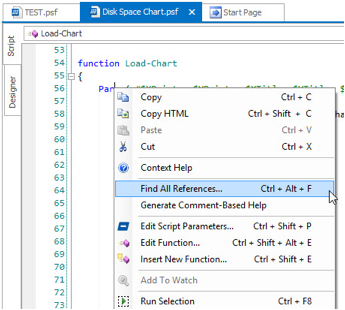
This command builds upon our existing reference highlighting feature. In addition to highlighting all the references, it will list all of the references in the Find Results panel.
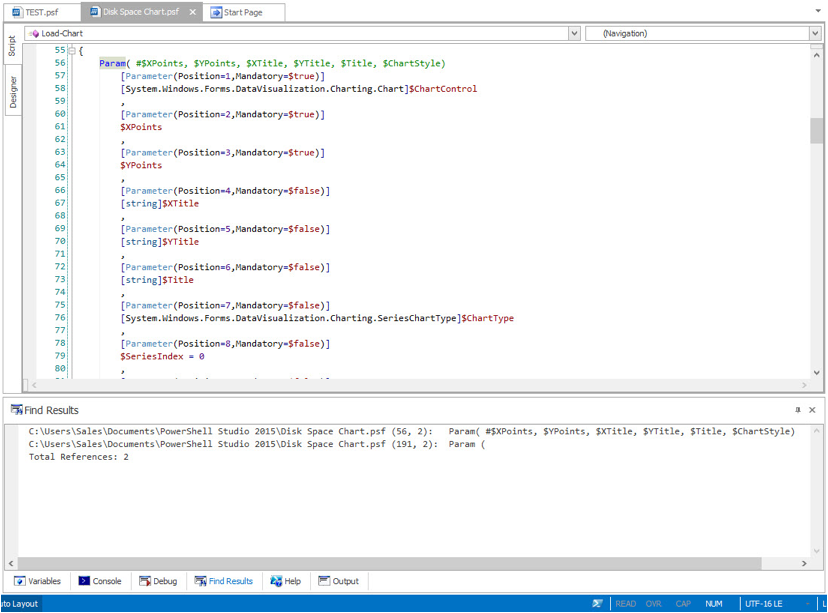
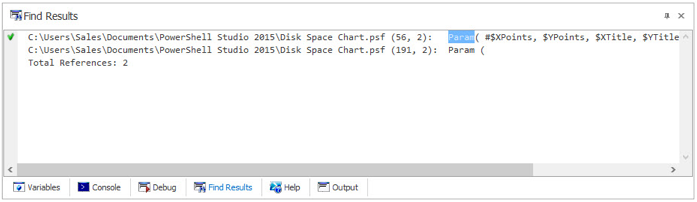
This makes it easier for you to navigate between references. Whenever you double-click on a reference in the panel, the Find Results panel will mark the reference as visited.
If you are working with a project, the references located in the other project files will also be listed in the search results.
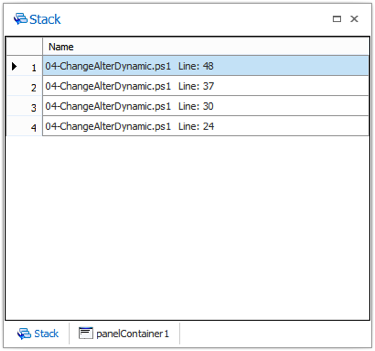
The Call Stack pane shows you the execution path through your script to the current breakpoint when debugging. Each line, except the first, represents a point where your script called a function. The first line is the location of the current breakpoint. Double clicking on a line in this window will take you to that distinct line in the code editor.
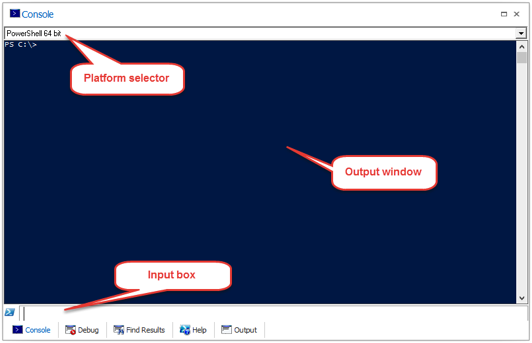
The console pane is an instance of PowerShell hosted in the IDE. It has three component parts:
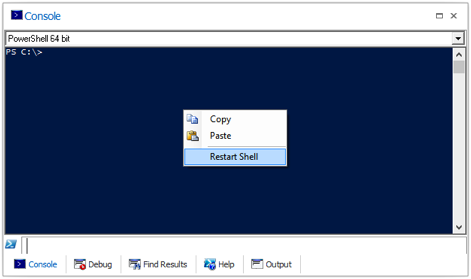
Right clicking in the Console window will display a context menu containing the following options:
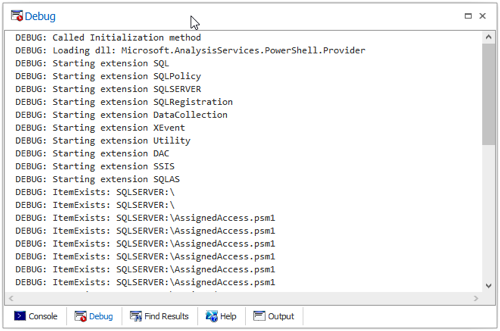
The Debug output pane shows you messages written to the debug stream - by Write-Debug, for example. It also records messages created by tracepoints in your code.
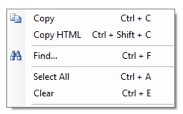
Right clicking in the Debug Output window will display a context menu containing the following options:
With the Debug Console, you can interact with the RunSpace while at a breakpoint. The console allows you to run commands or alter values in order to make debugging scripts easier. You can also simply experiment with what-if scenarios.
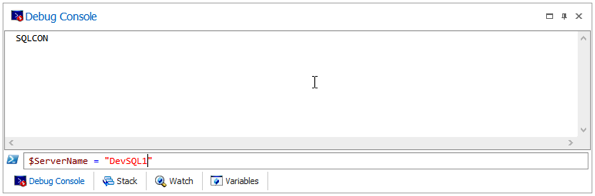
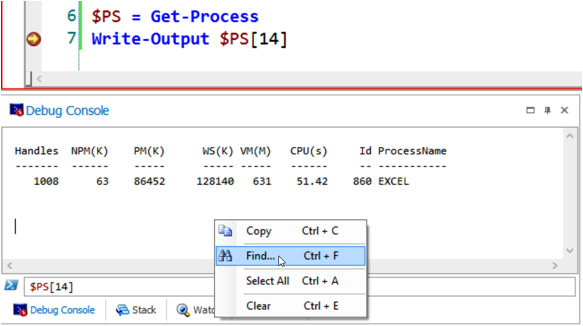
Right clicking in the Debug Console window will display a context menu containing the following options:
The object browser is one of the most useful features of PowerShell Studio. It collects together the following panes:
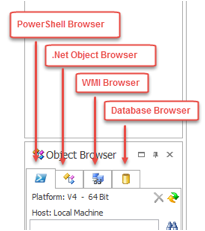
Each pane provides the same basic functionality, the ability to explore a collection of objects. Each pane also provides custom capabilities to help you integrate objects into your code.
The PowerShell browser displays PowerShell Cmdlets, aliases modules and help files.
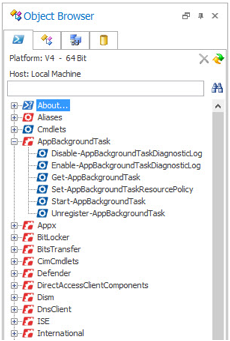
You can access the context menu by right clicking on a node:
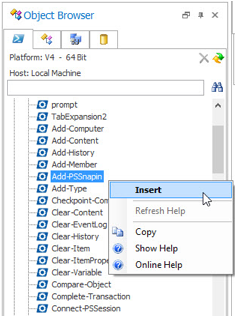
The context menu allows you to:
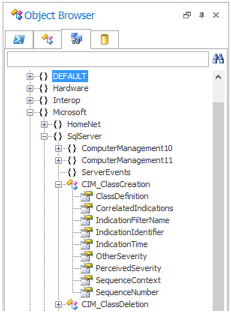
This browser displays the .Net assemblies available on your computer. Each assembly can be opened to reveal the namespaces and types contained within. Individual types can be opened up to reveal their contents - properties, methods etc.
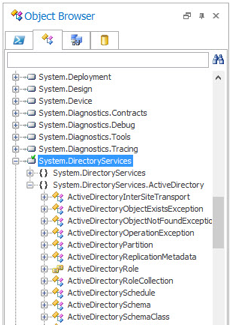
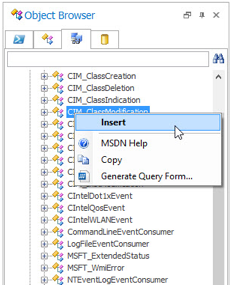
You can access the context menu by right clicking on a node:
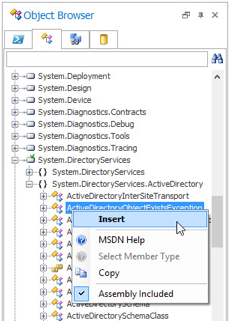
Right clicking on a node in the browser allows you to:
The WMI browser displays namespaces and objects from the WMI database on your computer. As you click on nodes in this panel, PowerShell Studio will display information and code examples about the node in the Help panel.
You can access the context menu for WMI objects by right clicking on a node.
The context menu offers the following options:
The Database Browser
The database browser allows you to explore databases and generate code to read and display data.
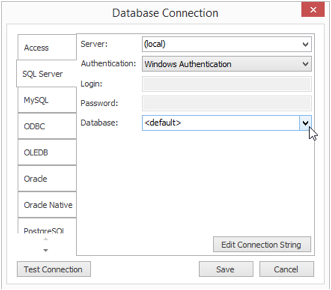
The first step in using this browser is to create a database connection. Click on the create connection button (
![]() ) to launch the connection dialog.
) to launch the connection dialog.
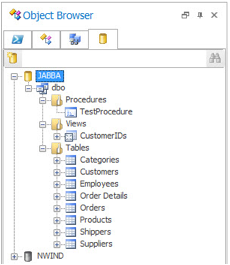
Once you have configured your connection, pressing Save will add a new node to the database browser. Clicking on the node will enumerate the contents of the database and allow you to tunnel into the tables, views, stored procedures, etc.
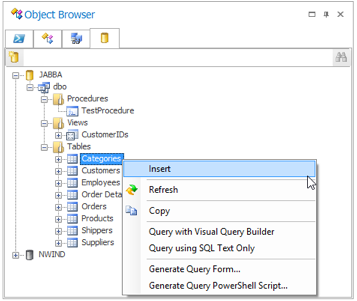
Right clicking on a database object provides these options:
The code generators provide a default connection string that you will need to edit to reflect your environment.
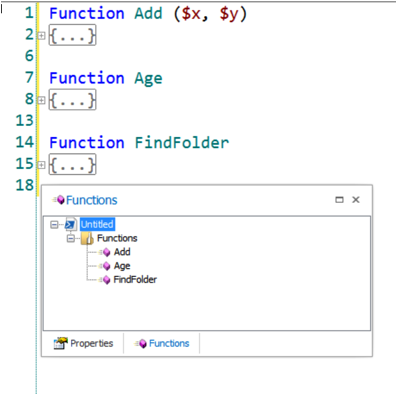
The function explorer pane displays all of the functions, events and workflows in the current context. When you are working on a single script, it will show the functions and workflows within that script.
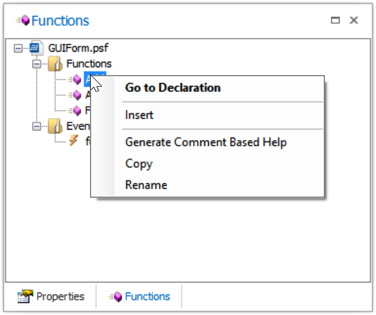
Right clicking on a function provides some useful capabilities:
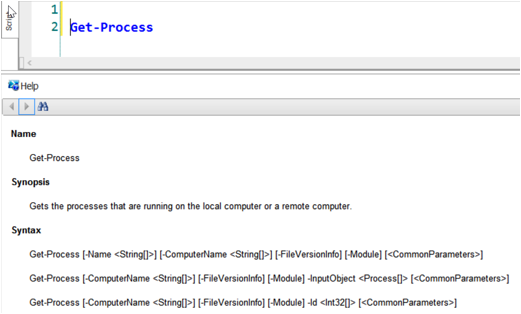
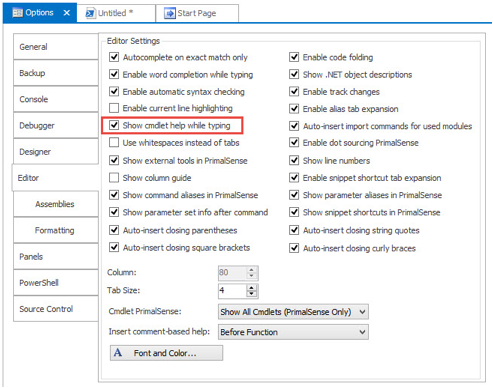
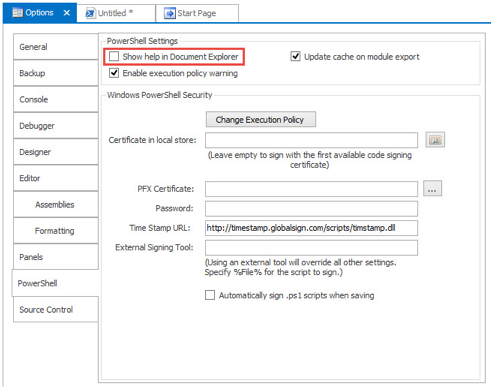
The help pane displays context sensitive PowerShell help about the last cmdlet, alias, or WMI object that was typed in the code editor window.
If PowerShell Studio is configured to use external help, the help will be displayed in the SAPIEN Document Explorer.
To ensure that help items will show up in the Help pane, you must configure two options:
Right clicking in the Help pane will display a context menu containing the following options:
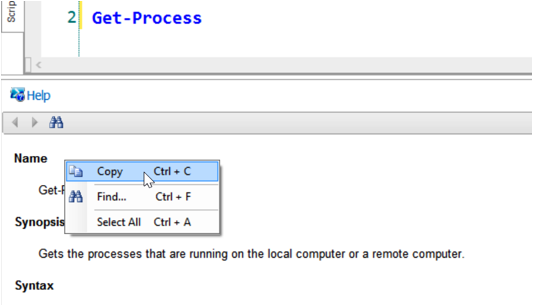
The three buttons at the top of the help window
![]() provide the following functions:
provide the following functions:
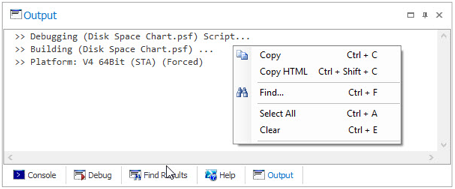
The Output Pane window displays normal script output.
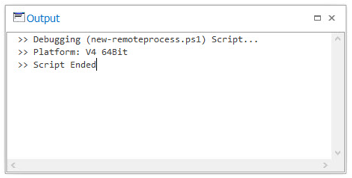
If an error message is displayed in this window, you can double click on it and you will be taken to the appropriate file in the code editor.
Right clicking in the Output pane will display a context menu containing the following options:
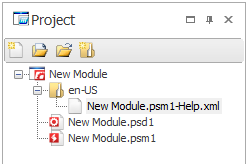
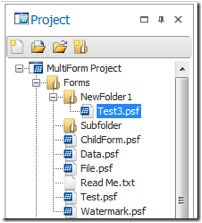
The project folders reflect the folder structure of the project files. Therefore, if you previously organized your project files in folders within the project's directory, those folders will automatically be displayed in the Project Panel once the project is loaded.
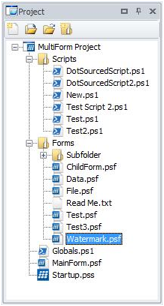
Using folders within projects makes it easier to organize projects with large amounts of files.
Important: Once PowerShell Studio updates the project file, you will no longer be able to open the project using older builds of PowerShell Studio. A backup of the project will be created before updating.
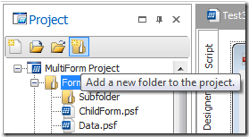
The buttons at the top of the pane
![]() provide four functions:
provide four functions:
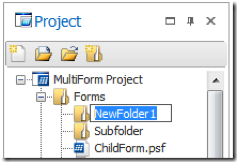
You can add folders by pressing the "New Folder" button in the Project Panel:
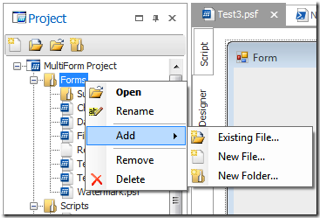
Or, you can add a new folder using the Project Panel's context menu:
The new folder will be created under the selected folder:
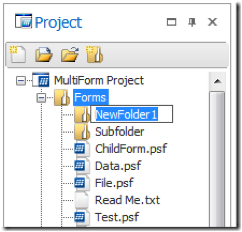
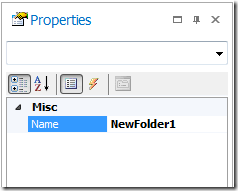
You can rename the folder by clicking twice on the node in the project panel or using the Rename command in the context menu:
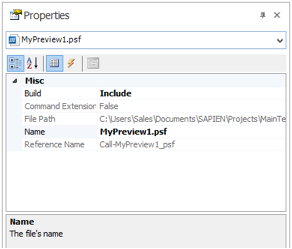
Alternatively, you can use the Property Panel to rename the folder:
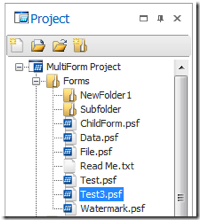
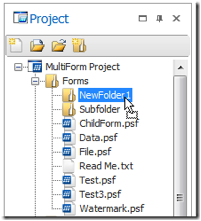
You can move files and folders simply by dragging and dropping them within the Project panel:
Important : To rename or move files you must use the Project Panel instead of Windows File Explorer, otherwise the project's references will point to incorrect paths. You can also right click on project files to access context sensitive options.
The property pane displays the properties of any object selected in the form editor or the project pane. You can edit the properties and, in the case of form controls, your changes will immediately be reflected in the design view.
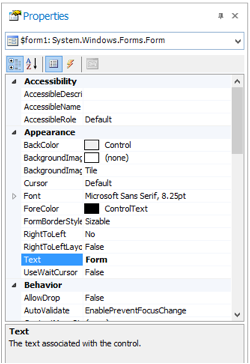
There are a number of controls at the top of the properties window:
Pressing F1 when a form or control property is selected will display MSDN help about that property in a browser window.
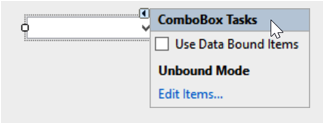
Some controls support an alternative way to modify control properties called smart tags. These appear as a small icon, on the top right of a control, when it is selected in the forms designer.
This screenshot shows the smart tag on a ComboBox control:
![]()
Clicking on the smart tag will display options specific to the control, and it will present an alternative task oriented way of modifying control properties.
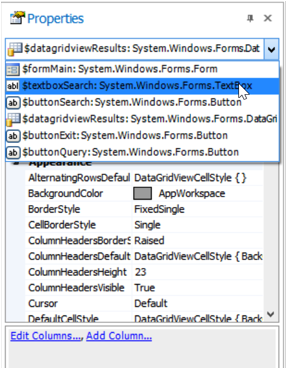
Event handlers can be created using the properties panel. To do this, first select a control in the designer and access the properties panel. Click on the lightning bolt button to display the events that belong to the control.
The following screenshot shows the events for a form. The load event has been connected to a handler called form1_Load.
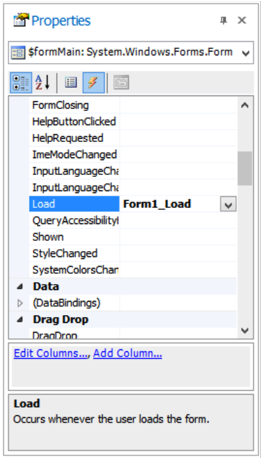
To handle another event, simply double click in the blank cell next to the event. PowerShell Studio will create an event handler named $<object name>_<event name>.
For example, double clicking in the blank cell next to FormClosing results in the following code being generated:
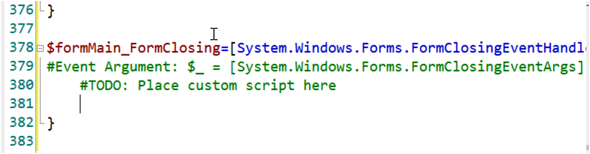
If you want to specify the name of the event handler you can type its name rather than double clicking in the blank cell. PowerShell Studio will use the name you type to generate the event handler.
PowerShell Studio provides an extensive collection of snippets to help you complete common coding tasks quickly.

Each snippet contains a block of code that can be added to a script by
Snippets can be recognized by the icon (
![]() ) that appears next to their name.
) that appears next to their name.
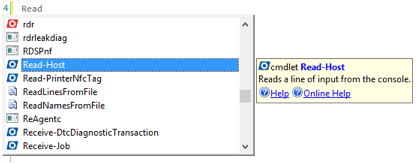
Once you have found the right snippet, press Tab to insert the code.
The buttons at the top of the snippet pane provide useful functions for managing snippets.
Snippets are loaded from following folder:
%ProgamData%\SAPIEN\PowerShell Studio 2015\Snippets\
You can also add an extra folder of your own to the snippet browser by specifying the folder path on the Panels tab of the Options dialog. This folder is always called 'custom' in the snippet browser.
The snippet editor is covered in detail in Chapter 16.
The toolbox pane is used when editing PowerShell forms. It provides lists of controls and control sets that can be used on a form.
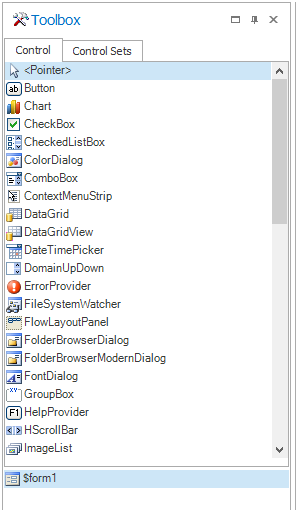
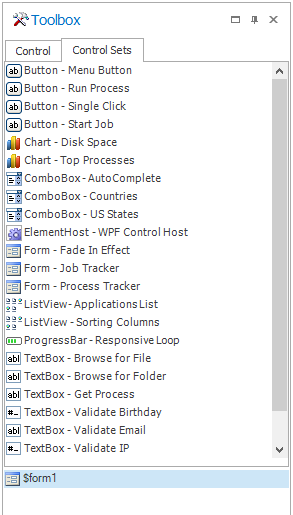
To add a control or control set to a form, simply click and drag it onto the form. The Toolbox separates controls and control sets onto two separate tabs.
Control sets are covered in detail in chapter 6.
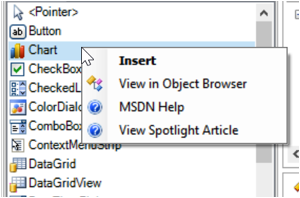
Right clicking on a control will provide access to a set of options:
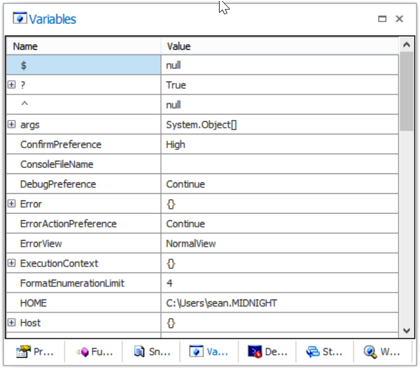
The Variables panel shows the current values of all PowerShell variables during a debugging session.
Debugging is covered in detail in chapter 5.
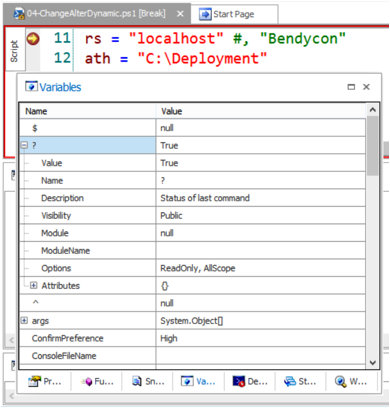
In addition to displaying the values of all variables, the Variables pane also lets you examine the properties of objects. Clicking on the plus sign (+) next to a variable name will open it up and display the public properties.
Nested objects can also be expanded in the same way, as shown below:
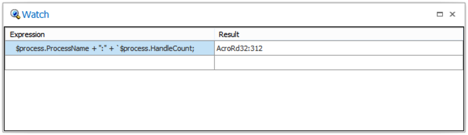
The Watch panel allows you to choose the variables you want to monitor during debugging.
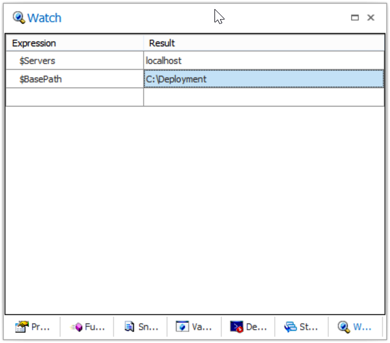
You can add a new variable by typing its name in the next free slot in the Expression column, or by highlighting the variable in your code and dragging it to the watch window. It is also possible to monitor the values of object properties or calculated expressions as shown below.
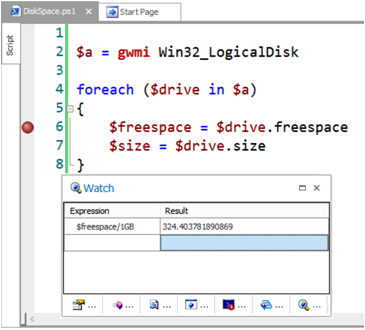
The debugger can evaluate complex expressions to help you see what results your script is coming up with. To evaluate an expression while a script is paused, highlight the expression in the code window.
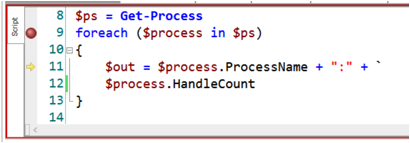
Drag the expression to the Expression Watch pane at the bottom-right portion of the PowerShell Studio window. The expression is immediately evaluated so that you can see its result. The expression will be re-evaluated each time a line of script is executed, so that you can continually view the expression's result.
Any number of expressions can be added to the list. To remove an expression, select it in the list and press Delete.