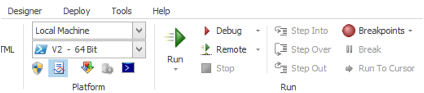
Ribbon controls related to script execution and debugging:
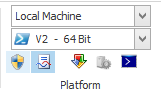
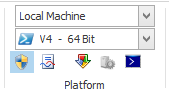
PowerShell comes in both 64-bit and 32-bit platforms. When you execute a script from PowerShell Studio, you can choose the required platform from the Platform section of the Home tab of the ribbon bar.
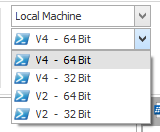
You can also select the version of PowerShell to run the script under.
PowerShell Studio runs your scripts with the privileges of the current user. It is considered a security best practice to avoid logging on as an administrator level account whenever possible. Sometimes your scripts will need to do things that require greater privileges; PowerShell Studio facilitates this by allowing you to run scripts in elevated mode. The Platform menu provides elevated, and non-elevated, modes for script execution.
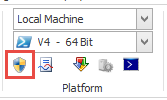
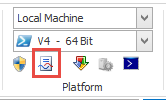
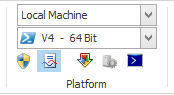
Above, the Elevation button above is currently inactive, meaning that the script is not running under elevated privileges. Below, the elevation is activated (note the blue highlight).
STA (Single Threaded Apartment) mode allows you to start your script in single threaded mode. This is essential when your script uses forms to interact with the Windows GUI. Some GUI controls require STA mode in order for them to function correctly.
The following screenshot shows the STA Mode as inactive:
The following screenshot shows the STA Mode as active.
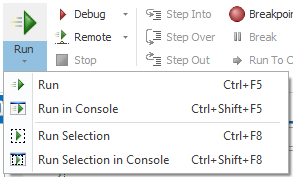
Script execution options are accessed from the Run section of the ribbon.
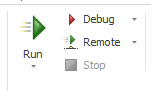
Expanding the Run button shows the following options.
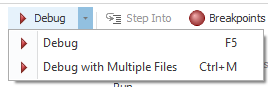
PowerShell Studio also offers the ability to debug a script in elevated mode by setting the appropriate platform setting as described above. The script will run normally with output, captured to the Output tab, until a breakpoint is reached. A yellow arrow in the margin of the code window indicates the next line of code that will be executed.
If your script begins with a Param block, PowerShell Studio will display a dialog box to allow you to enter values for script parameters.
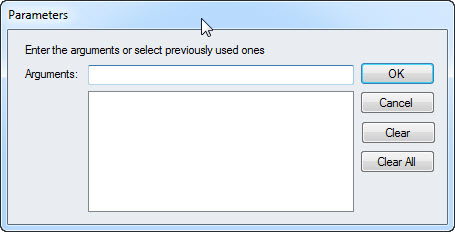
Parameter values are entered in the Arguments text box with a space between each value. PowerShell Studio will remember the values you type and display them under the textbox so that you can reuse previous values quickly. The Clear and Clear All buttons allow you to remove one or all of the previous parameter values.
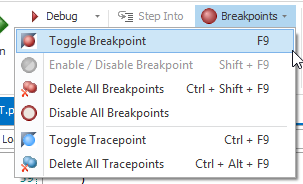
Breakpoints instruct the debugger to stop on a specified line of code. This allows you time to review what the script is doing at that point. To set a breakpoint, place your cursor on the desired line and either press F9 or choose the Toggle Breakpoint button from the Break Points menu in the Debug section of the Home ribbon tab.
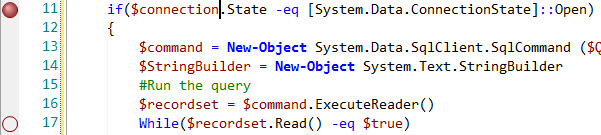
Active breakpoints are displayed as solid red circles in the margin of the code editor window. Disabled breakpoints are displayed as red rings.
Once a breakpoint is set, you can disable or delete it by using the Breakpoints menu or pressing F9 to toggle through the options. You can also right click on the code editor to access the Breakpoints menu.
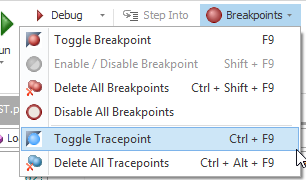
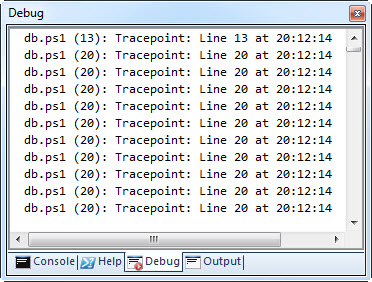
A Tracepoint causes PowerShell Studio to write a message to the debug window when a particular line of code is executed. Tracepoints are created by:
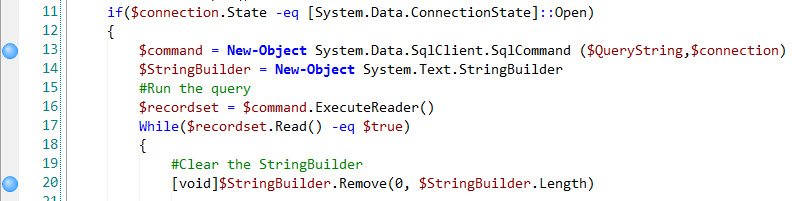
Tracepoints appear as solid blue circles in the code editor margin:
When this code is executed, it reads 10 records from a database table and the Tracepoint output looks like this:
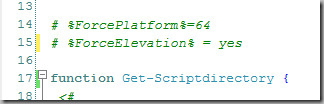
PowerShell Studio allows meta comments to be used to change how and where your scripts are run. You can run scripts in 32 or 64-bit mode, elevated or not, remotely or locally, and so on. These meta comments override your current platform settings. Many options can be changed or set via meta comments such as:
You may also combine meta comments. For example, the following will cause the script to be run in 64-bit mode *and* elevated:
You can specify optional credentials as well. For instance, the following meta comments will force the script to run on the remote machine JABBA and will prompt for user name and password:
# %ForceHost%=JABBA,Prompt
While the following meta comments will force the script to run on JABBA but will only prompt for the password for the user named "Alex":
# %ForceHost%=JABBA,Alex,Prompt
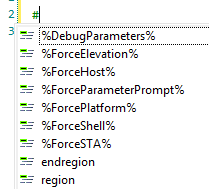
For reference, all available meta comments are:
PrimalSense will also offer help when appropriate:
During a debugging session, PowerShell Studio displays a collection of panes to help you resolve problems in your code. These include:
See chapter 7 for a detailed explanation of each of these panes.
PowerShell Studio allows you to debug scripts as they run on another machine. It does this using SAPIEN's Remote Scripting Execution Engine and this must be installed on any machine that will host remote scripts. The installation files can be found in:
%program files%\PowerShell Studio 2015\RSEE Redistributables
Both 32 and 64-bit versions are provided.
Installation and configuration of the Remote Scripting Execution Engine is covered in chapter 15.
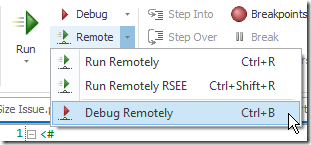
Remote script execution is also supported. PowerShell Studio can use two different mechanisms to execute scripts or packages on a remote machine.
When using PowerShell Remoting:
In both cases the Remote Credentials dialog will be displayed:
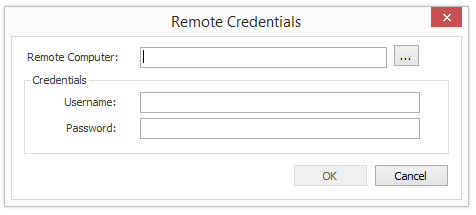
Enter the required information and press OK. Your script will be executed on the chosen machine and the results will be displayed in the Output panel.
NOTE: When you run a script remotely, it cannot interact with the desktop. Therefore you cannot include any code that prompts the user for input (such as Read-Host, Get-Credential or any forms).
When using the RSEE:
In both cases the Remote RSEE dialog will be displayed:
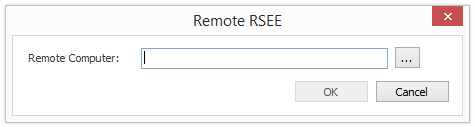
From here you either enter the name of the remote computer or press the browse button
![]() to launch a network browser window.
to launch a network browser window.
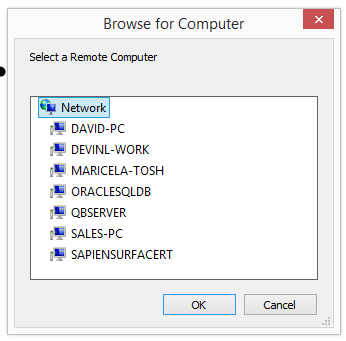
To choose a computer in this window, click on its name and press OK.
Once you have selected the remote computer press OK. Your script will be executed on the chosen machine and the results will be displayed in the Output panel.